This post follows on from last week’s post on the iterative process of doing qualitative data analysis. Last week I wrote a more general musing on the challenges inherent in doing qualitative analysis; this week’s post is focused more on the ‘tools’ or processes I used to think and work my way through my iterative process. I drew quite a lot on Rainbow Chen’s own PhD tools as well as others, and adapted these to suit my research aims and my study (reference at the end).
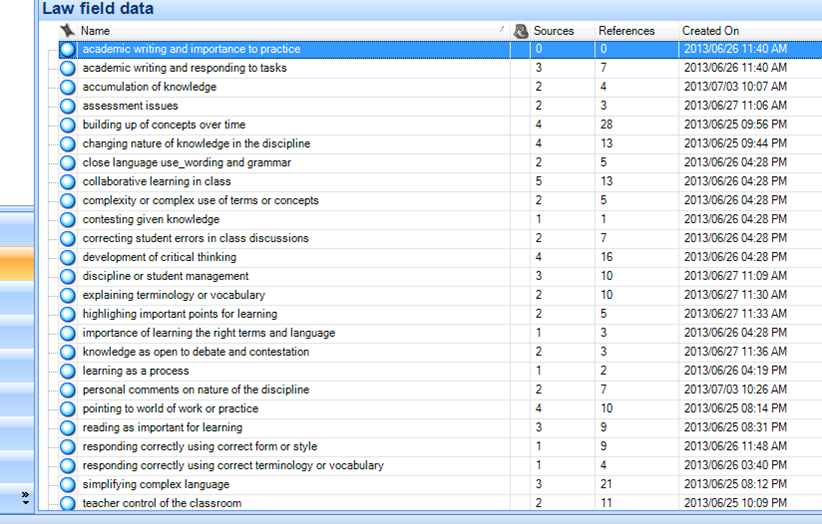
The first tool was a kind of ’emergent’ or ‘ground up’ form of organisation and it really helps you to get to know your data quite well. It’s really just a form of thematic organisation – before you begin to analyse anything, you have to sort, organise and ‘manage’ your mountain of data so that you can see the wood for the trees, as it were. I didn’t want to be overly prescriptive. I knew what I was looking for, broadly, as I had generated specific kinds of data and my methodology and theorology were very clearly aligned. But I didn’t really know what exactly all my data was trying to tell me and I really wanted it to tell its story rather than me telling it what it was supposed to be saying. I wanted, in other words, for my data to surprise me as well as to show me what I had broadly hoped to find in terms of my methodology and my theoretical framework. So, the ‘tool’ I used organised the data ‘organically’ I suppose – creating very descriptive categories for what I was seeing and not trying to overthink this too much. As I read through my field notes, interview transcripts, video transcripts, documents, I created categories like ‘focusing on correct terminology’ and ‘teacher direction of classroom space’ and ‘focus on specific skills’. The theory is always informing the researcher’s gaze, as Chen notes in her paper (written with Karl Maton) but to rush too soon to theory can be a mistake and can narrow your findings. So my theory was here, underpinning my reading of the data, but I did not want to rush to organise my data into theoretical and analytical ‘codes’ just yet. There was a fair bit of repetition as I did this over a couple of weeks, reading through all my data at least twice for each of my two case studies. I put the same chunks of text into different categories (a big plus of using data software) and I made time to scribble in my research journal at the end of each day during this this process, noting emerging patterns or interesting insights that I wanted to come back to in more depth in the analysis.
The second process was what a quantitative researcher might call ‘cleaning’ the data. There was, as I have noted, repetition in my emergent categories. I needed to sort that out and also begin to move closer to my theory by doing what I called ‘super-coding’ – beginning to code my data more clearly in terms of my analytical tools. There were two stages here: the first was to go carefully through all my categories and merge very similar ones, delete unnecessary categories left over after the merging, and make sure that there were no unnecessary or confusing repetitions. I felt like the data was indeed ‘cleaner’ after this first stage. The second stage was to then super-code by creating six overarching categories, names after the analytical tools I developed from the theory. For example, using LCT gave me ‘Knowers’, ‘Knowledge’, ‘Gravity’ and ‘Density’. I was still not that close to the theory here so I used looser terms than the theory asks researchers to use (for example we always write ‘semantic gravity’ rather than just ‘gravity’). I then organised my ‘emergent’ categories under these headings, ending up with two levels of coded data, and coming a step closer to analysis using the theoretical and analytical tools I had developed to guide the study.
By this stage, you really do know you data quite well, and clearer themes, patterns and even answers to your questions begin to bubble up and show themselves. However, it was too much of a leap for me to go from this coding process straight into writing the chapter; I needed a bridge. So I went back to my research journal for the third ‘tool’ and started drawing webs, maps, plans for parts of my chapters. I planned to write chunks, and then connect these together later into a more coherent whole. This felt easier than sitting myself down to write Chapter Four or Chapter Five all in one go. I could just write the bit about the classroom environment, or the bit about the specialisation code, and that felt a lot less overwhelming. I spent a couple of days thinking through these maps, drawing and redrawing them until I felt I could begin to write with a clearer sense of where I was trying to end up. I did then start writing, and working on the chapters, and found myself (to my surprise, actually) doing what looked and felt like and was analysis. It was exciting, and so interesting – after being in the salt mines of data generation, and enduring what was often quite a tedious process of sitting in classrooms and making endless notes and transcribing everything, to see in the pile of salt beautiful and relevant shapes, answers and insights emerging was very gratifying. I really enjoyed this part of the PhD journey – it made me feel like a real researcher, and not a pretender to the title.


This part of the PhD is often where we can make a more noticeable contribution to the development, critique, generation of new knowledge, of and in our fields of study. We can tell a different or new part of a story others are also busy telling and join a scholarly conversation and community. It’s important to really connect your data and the analysis of it with the theoretical framework and the analytical tools that have emerged from that. If too disconnected, your dissertation can become a tale of two halves, and can risk not making a contribution to your field, but rather becoming an isolated and less relevant piece of research. One way to be more conscious of making these connections clear to yourself and your readers is to think carefully about and develop a series of connected steps in your data analysis process that bring you from you data towards your theory in an iterative and rich rather than linear and overly simplistic way. Following and trying to trust a conscious process is tough, but should take you forward towards your goal. Good luck!

Reference: Chen, T-S. and Maton, K. (2014) ‘LCT and Qualitative Research: Creating a language of description to study constructivist pedagogy’. Draft chapter (forthcoming).

Thanks so much for the last two posts, Sherran – as a first time qualitative researcher just entering the data generation phase of my PhD, it’s exciting but a little daunting watching my ‘pile of salt’ slowly beginning to grow… I know I will come back to these posts – they are helpful on several levels!!
Hi Jessica – thanks for the feedback and all the best with the data generation. I hope it all goes well. 🙂
I am printing this out and putting it in my PhD Book for iterative reference during my data analysis phase 🙂
The last two chapters are always a problem to me, I’ve experienced that during my honours research project. I’m busy with my masters proposal now but this post makes me believe that I will easily overcome data analysis and synthesis steps, thank you so much!
You are most welcome – thank you for that feedback!
I have struggled a lot with data generation and analysis during my honours research project. I so wish I could have seen this post before. I’m busy with masters proposal and this post makes me believe that I will easily overcome the steps and get done with my last chapters for good.You really make life to seem so easy, thank you a lot!